Applies to Platform: UTM 2.4, UTM 2.5, 4i Edge 2.5
Last Update: 21 March 2018
Applies to Platform: UTM 3.0, 4i Edge 3.0, UTM 5.0, 4i Edge 5.0
Last Update: 21 March 2018
Web-Based CLI


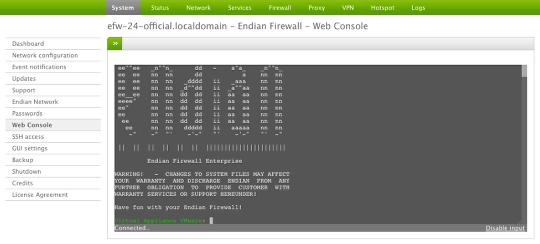
Remember that with Version 2.4, there is now a web-based console that provides a full CLI experience through the browser. It can be found under System > Web Console.
Ping
root@endian~#: ping 192.168.100.1
PING 192.168.100.1 (192.168.100.1) 56(84) bytes of data.
64 bytes from 192.168.100.1: icmp_seq=0 ttl=64 time=0.521 ms
64 bytes from 192.168.100.1: icmp_seq=1 ttl=64 time=0.432 ms
^C
--- 192.168.100.1 ping statistics ---
2 packets transmitted, 2 received, 0% packet loss, time 1001ms
rtt min/avg/max/mdev = 0.432/0.476/0.521/0.049 ms, pipe 2
Ping is the most common network diagnostic tool used to test basic network connectivity between the local and a remote device.
Example: To ensure proper internal connectivity by pinging an internal device or to test Internet connectivity by pinging an Internet address (www.google.com)
Common Use (Type CTRL-C to stop the ping):
ping < IP address / hostname >
Help Command:
ping -h
Warning
Traceroute
root@endian~#: traceroute 192.168.70.39
traceroute to 192.168.70.39 (192.168.70.39), 30 hops max, 38 byte packets
1 192.168.100.1 (192.168.100.1) 0.791 ms 0.749 ms 0.736 ms
2 192.168.58.15 (192.168.58.15) 240.728 ms 210.988 ms 244.472 ms
3 192.168.70.39 (192.168.70.39) 233.712 ms 231.918 ms 275.377 ms
Traceroute is a useful network diagnotic tool used to show the hops (path) taken from the local device to a remote device.
Example: To ensure traffic is taking the expected path out to the Internet or to ensure VPN traffic is going through the tunnel
Common Use (Type CTRL-C to stop the trace):
traceroute < IP address / hostname >
Help Command:
traceroute -h
Telnet
Telnet was a traditional remote connection method but is now more useful.
Example: To ensure traffic is taking the expected path out to the Internet or to ensure VPN traffic is going through the tunnel
Common Use (Type CTRL-C to stop the connection):
telnet < IP address / hostname >
Help Command:
telnet --help
Network Connections
root@endian~#: netstat -anpt
Active Internet connections (servers and established)
Proto Recv-Q Send-Q Local Address Foreign Address State PID/Program name
tcp 0 0 127.0.0.1:199 0.0.0.0:* LISTEN 9635/snmpd
tcp 0 0 127.0.0.1:10024 0.0.0.0:* LISTEN 566/amavisd
tcp 0 0 127.0.0.1:10025 0.0.0.0:* LISTEN 462/master
tcp 0 0 127.0.0.1:10026 0.0.0.0:* LISTEN 375/postgrey.pid
tcp 0 0 0.0.0.0:10443 0.0.0.0:* LISTEN 14698/httpd
tcp 0 0 127.0.0.1:3310 0.0.0.0:* LISTEN 19111/clamd
tcp 0 0 127.0.0.1:9998 0.0.0.0:* LISTEN 19741/havp
Netstat is a useful network connection tool used to show all existing network connection and open sockets.
Example: To verify a service is running and is using the right TCP/UDP port or to review running services.
Common Use (Type CTRL-C to stop the connection's display):
netstat -anpt [Show TCP connections]
netstat -anpu [Show UDP connecitons]
Help Command:
netstat -h
tcpdump
Tcpdump allows to display realtime traffic flowing through one or more network interfaces. It is best used to select traffic flowing from one host to another and/or between ports. The output can also be saved on a .pcap file for later analysis (e.g., import it in wireshark).
Note that reading all real traffic can be very difficult, as every single packet is shown, so better select only the traffic that you want to check.
Example: Check if there is traffic between a host behind the Endian and a remote server.
Common Use (Type CTRL-C to stop the connection's display):
tcpdump -i br0 host 192.168.0.123 [show all traffic on NIC br0 involving host 192.168.0.123]
tcpdump -i any -w voip.pcap port 5060 [Check all VoIP traffic on all interfaces and save the output in file voip.pcap]
Help Command:
tcpdump -h
Commenti