Applies to Platform: UTM 2.4, UTM 2.5
Last updated: 12th July 2013
Applies to Platform: UTM 3.0
Last updated: 10th Febraury 2016
The proxy graph normally appear under Menubar > Status > Proxy graphs. However, they sometimes do not show up, and a message like the one in the picture below is displayed.
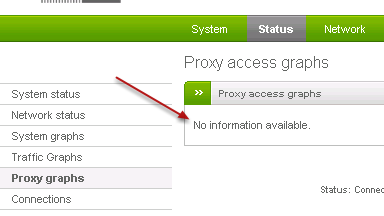
The reason for that message to appear is that either the HTTP Proxy or the HTTP Proxy logging is disabled. Indeed, graphs are generated from the log files of the HTTP proxy and display the traffic of the day before. If you are interested in seeing the graphs, you should enable the logging.
Enabling the HTTP Proxy logging
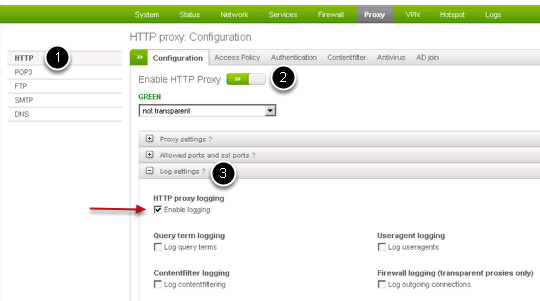
To activate the HTTP Proxy logging, follow these steps:
- Go to Menubar > Proxy > HTTP.
- If not enabled, click on the gray switch to enable the HTTP Proxy.
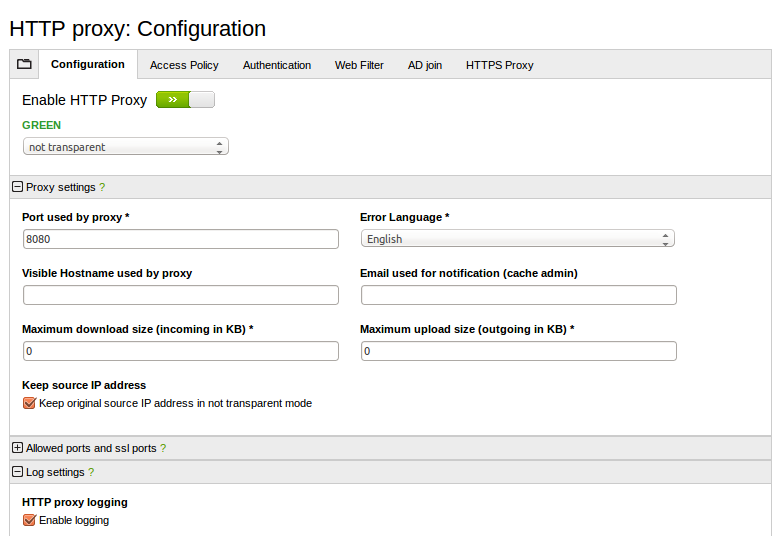
- Click on Log Settings to reveal the panel containing the options for logging.
You can choose how many options you want, but at least Enable logging must be selected. All the available options are described in under Log settings in the HTTP Proxy section of the online manual.
You can choose how many options you want, but at least Enable logging must be selected. All the available options are described in under Log settings in the HTTP Proxy section of the online manual.
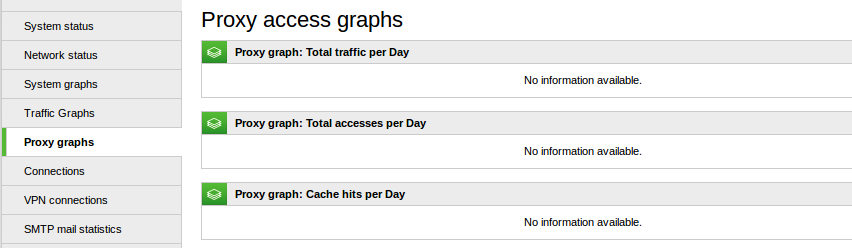
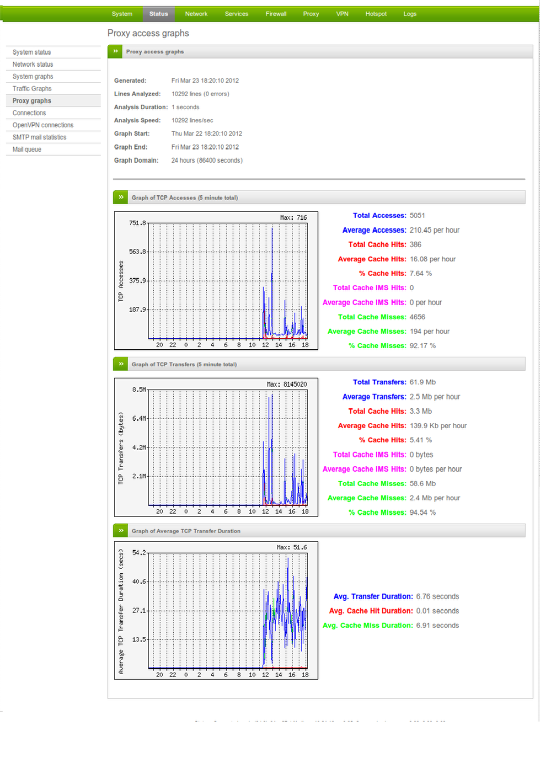
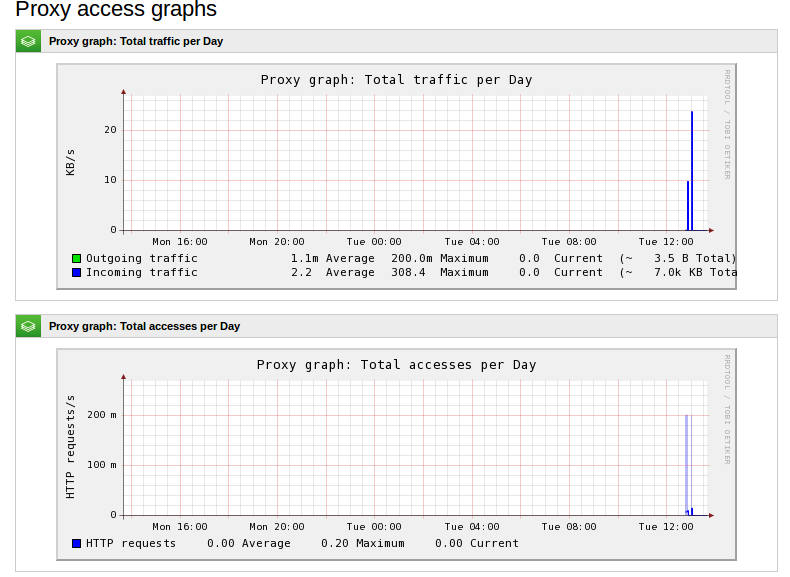
After you have enabled logging, the next day you will see a picture like the following one under Menubar > Status > Proxy graphs:
Commenti